Legislative District Profiles
Newly available census data provides a glimpse into the diversity among Nebraska’s 49 legislative districts.
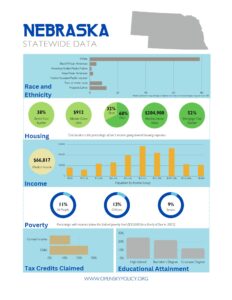
OpenSky compiled the data and has produced fact sheets for the 49 districts and the state as a whole. Each profile includes information on income, housing, race and ethnicity, educational attainment and other demographics.
An interactive graphic focuses on income levels, showing the concentration of higher incomes in eastern Nebraska and the disparity in incomes among districts in the metro areas.
The data is the latest available for the legislative districts redrawn following the 2020 census. To view a fact sheet, click on the legislative district below.
| LD1 | LD2 | LD3 | LD4 | LD5 | LD6 | LD7 |
| LD8 | LD9 | LD10 | LD11 | LD12 | LD13 | LD14 |
| LD15 | LD16 | LD17 | LD18 | LD19 | LD20 | LD21 |
| LD22 | LD23 | LD24 | LD25 | LD26 | LD27 | LD28 |
| LD29 | LD30 | LD31 | LD32 | LD33 | LD34 | LD35 |
| LD36 | LD37 | LD38 | LD39 | LD40 | LD41 | LD42 |
| LD43 | LD44 | LD45 | LD46 | LD47 | LD48 | LD49 |

